Knowledge is power, particularly in the contact center.
The more you know about your contact center, the easier it is to drive results.
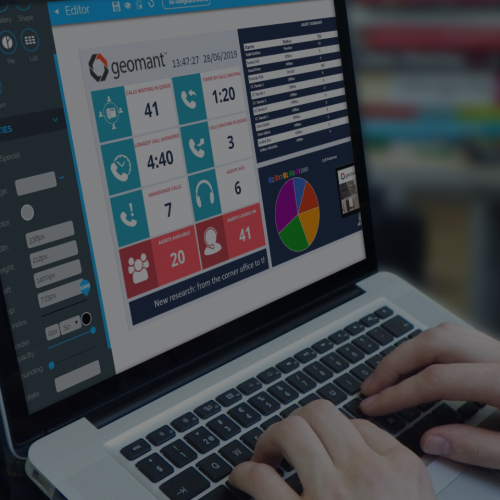
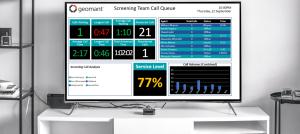
Wallboards allow companies to track crucial metrics like call volume, calls waiting, and average hold time. Consolidated metrics give supervisors and managers a clear overview of how the contact center is performing. At the same time, agents can compare their performance to peer benchmarks and track progress towards their goals.
With strategically placed graphics and visual announcements on a wallboard solution, companies motivate, inspire, and inform their people. This technology is increasingly valuable at a time when remote and hybrid workplaces are growing in popularity. Reuters suggests that the number of permanent remote workers will double in 2021, driven by the productivity gains flexible teams saw during 2020.
So, how do you leverage the power of the wallboard in a transformative environment? It all starts with knowing which information has the most significant impact. Here’s your guide to which metrics work best for wallboards in any environment.
Wallboards in the new age of work
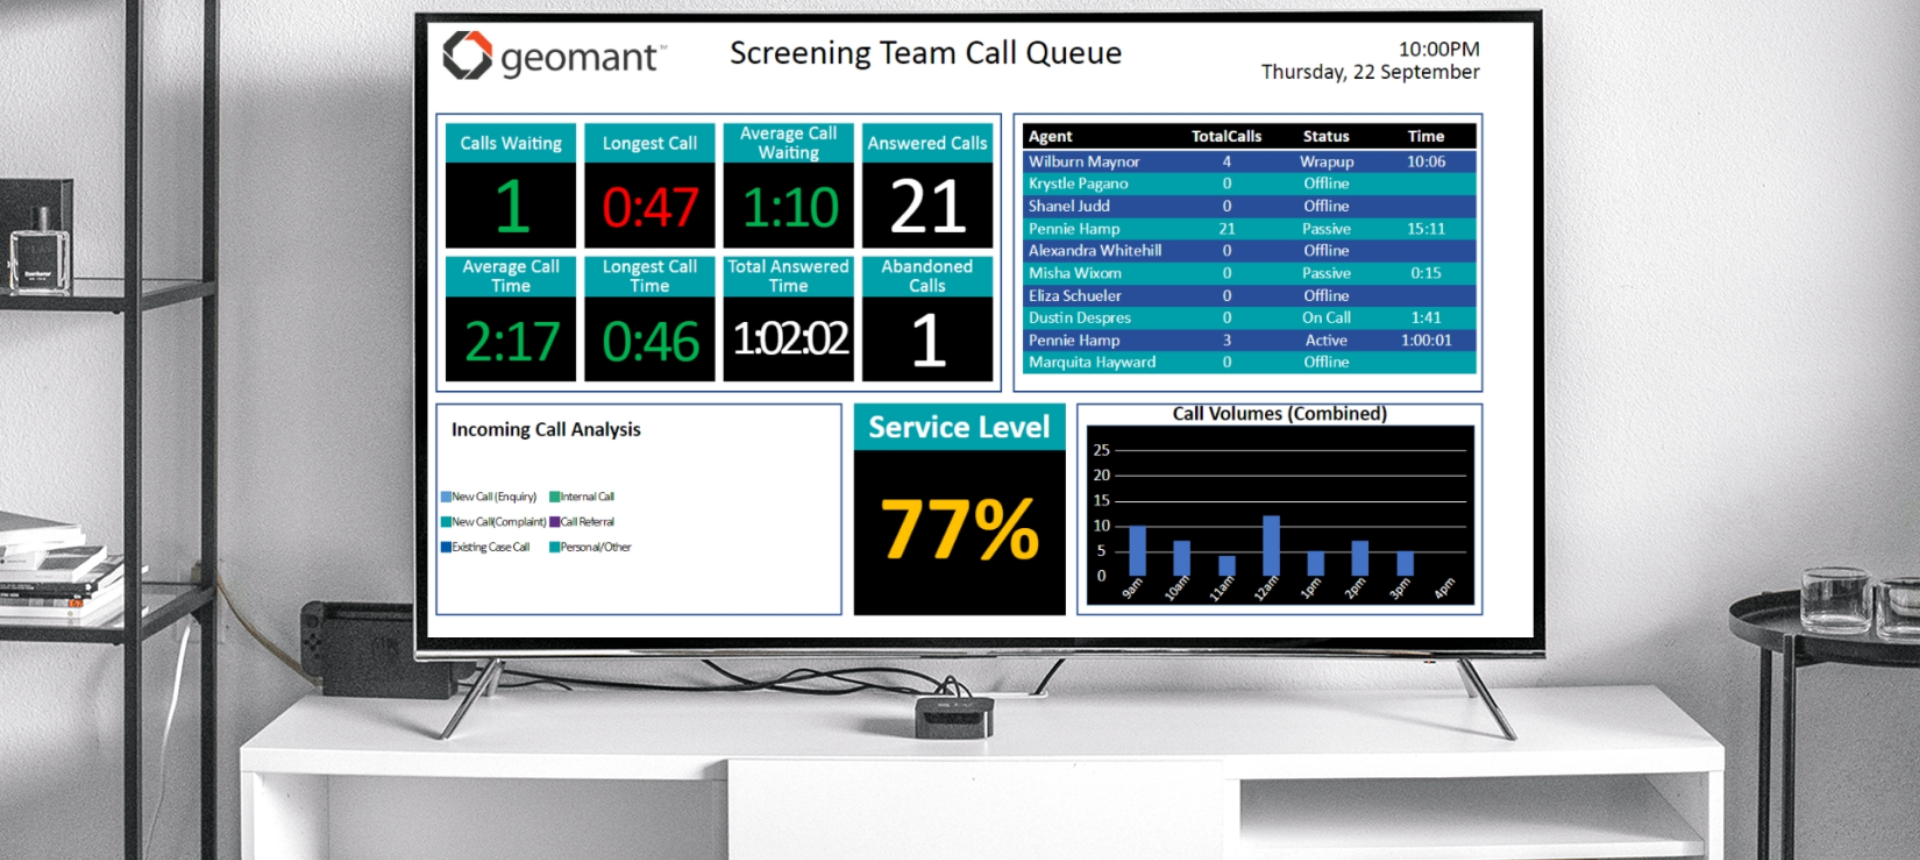
77% of contact centers switched to having 50% of their workforce or more operating from home in 2020, during the pandemic. This shift in working practices means that companies can’t just rely on having the right wallboards active in their centers; they need to think about remote workers.
Figuring out which metrics are most valuable for at-home workers and how to display that information in an easy-to-consume format is crucial. Remember, wallboards are most effective when they engage and inspire your agents, they:
- Define benchmarks for performance so new and existing agents know what’s expected.
- Motivate agents to rise in the ranks and achieve recognition.
- Provide agents and supervisors with valuable information about contact center trends.
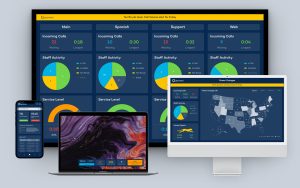
The days of old-fashioned and inefficient LED wallboards are over. Today’s companies have been moving towards digital alternatives for some time. Many companies run their wallboard technology through lightweight applications. The same apps that work in an office can deliver useful information to a home-based computer or browser.
Metrics for the Hybrid contact center Team
If, like many companies, you’re shifting to a hybrid work environment with both remote and in-office employees, you’ll need a wallboard that displays all of the right information in the contact center, as well as in remote settings.

Start with the basics – operational metrics
First, business leaders need to ensure they’re tracking, monitoring, and visualizing the essential contact center metrics. These are the numbers that monitor the ongoing health of your contact center, operational metrics to watch include:
- Incoming call quantity/ Calls in queue: Most contact centers already monitor their number of incoming calls to determine how many staff members they need to handle demand. However, as the omnichannel customer service environment continues to evolve, hybrid teams will also need to monitor the number of incoming chat messages too. Moving customers to digital channels can be an excellent way to handle rising numbers of inbound activity. Agents in a remote environment can even handle multiple chats at the same time. Companies could route voice calls to office-based agents, while having home agents working on chats. All the while, your wallboard technology shows everyone what kind of demand they’re dealing with.
- Average handle time: AHT refers to the amount of time an agent spends on a call (or in a chat conversation). The count begins from the moment the agent picks up the conversation, and it ends when the customer disconnects. Tracking this metric on wallboards for both remote and in-office agents will give them a benchmark to work towards. All team members will be on the same page about the amount of time they should be devoting to calls. If your team leaders notice some staff members constantly exceeding AHT, they can offer additional training and support. If agents are too far below the AHT, supervisors can follow up to determine that they’re addressing customer issues comprehensively.
- Average hold time: Average hold time has increased drastically since the start of the pandemic. Customers are being forced to wait longer to get answers from teams. The longer they wait, the more your abandonment rate goes up, and your reputation suffers. Use average hold time on your wallboards to keep track of how quickly your employees are picking up and handling calls, or chat conversations in any environment. If hold time is too long, you may need to introduce more personnel, better routing strategies, or additional channels for customer contact.
- Abandon rate: This refers to the number of people who simply give up on the call. Customers end calls for a range of reasons, but if your clients are hanging up because your hold times are too high, your handle times aren’t right, or you’re not routing people to the right agents on the correct channels, you’ll need to go back to the drawing board. Look at your abandonment rate in the context of the other operational metrics evident on your wallboard. What trends can you glean from the data?
Customer Experience Call Center Metrics and KPIs?
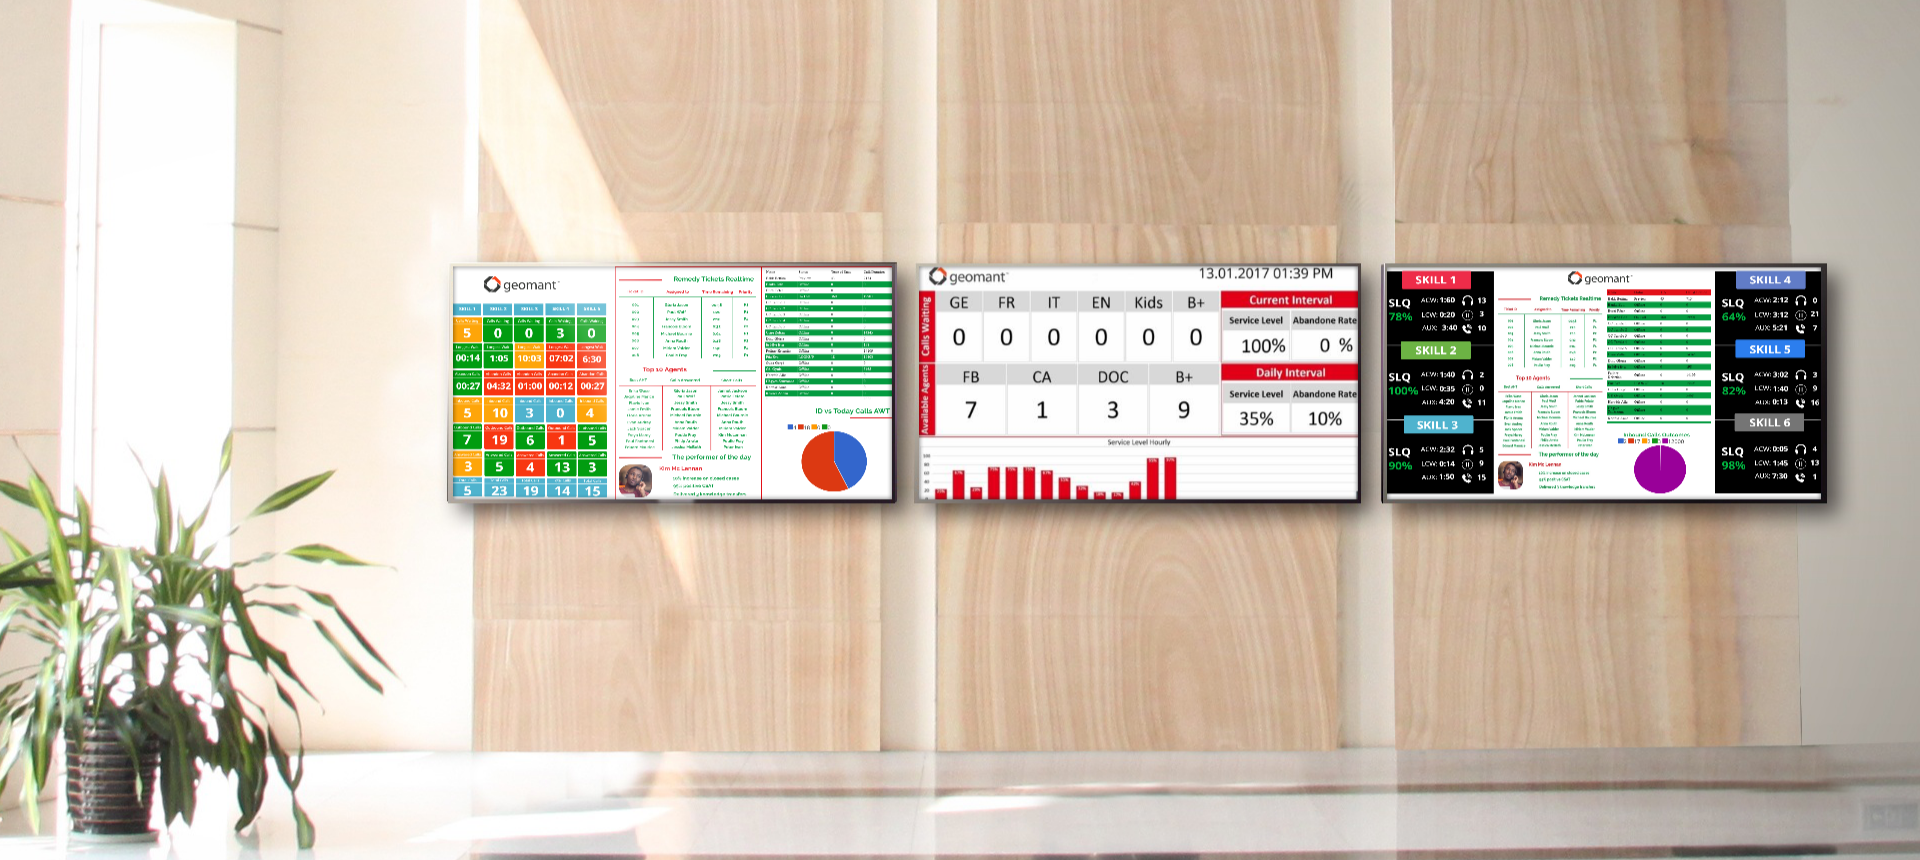
Whether your employees are present in the office or working remotely, their aim should always be to deliver the best possible experiences. Hybrid and remote workers are currently getting used to a new environment, where there may be additional distractions and challenges to consider. If you’re not careful, confusion in the workplace and the remote landscape could harm your CX performance.
Now that 88% of global consumers say that they plan on sticking with the brands that they’ve had good experiences with during this difficult time, it’s more important than ever to get that experience right.
With your wallboard metrics, keep a close watch on proven CX metrics, to ensure that you continue to live up to expectations, no matter how your team operations change. Metrics to consider include:
- First contact resolution (FCR): FCR shows whether your customers’ problems are being resolved the first time they reach your organization. Showing this information on your wallboards will give your employees an insight into how well they’re maintaining high levels of customer satisfaction. You’ll also be able to gain insights from FCR combined with other metrics. For instance, if your FCR is low and your average handle time is also low, your staff may not be spending enough time on calls.
- Net Promoter Score (NPS): Net Promoter Score measures loyalty and satisfaction levels among your customers. Many companies use NPS to determine how likely your customers are to recommend you to others. The higher your NPS score, the happier your clients are likely to be.
- Customer Effort Score: Just because some of your employees are working in the office and others are working remotely, doesn’t mean that your customers should have to do more work. CES, or Customer Effort Score tracks how much effort clients are having to put in to get resolutions to their problems. This is often measured on a five- or seven-point scale. If customers are working harder to resolve issues with your remote employees, what could simplify the process for them?
- Customer Satisfaction: The CSAT score, or Customer Satisfaction score is a commonly used metric for determining the satisfaction levels of your customers. CSAT often comes at the end of a customer survey, when companies use a five-point scale to rate service as highly satisfactory, or highly unsatisfactory. Allow your agents to see how their CSAT score relates to the CSAT performance of the business as a whole. Employees struggling with a low CSAT score may need additional training on handling customer issues and understanding client sentiment.
A survey tool integrated directly with your platform for contact center technology will allow you to collect all of the data you need for the above metrics. From there, you can arrange the information most likely to inspire, educate, and direct your employees onto your wallboard software.
Agent Productivity Call Center KPIs

Excellent customer experiences are dependent on empowered and informed employees.
Although many studies indicate that productivity levels can thrive in a remote and hybrid working environment, the initial shift to a new work style is sure to cause disruption. With the right contact center APIs, companies can keep an eye on agent performance, and how it’s affected by different working environments.
Agent productivity metrics presented on a wallboard can also give your team members insights into the kind of performance expected from them, while showing supervisors who needs extra guidance or direction. Common metrics used to motivate higher levels of performance from employees include:
- Agent utilization rate: Customer service is a labor-intensive job. Businesses need to ensure that team members are using their time as effectively as possible. Using agent utilization rate, companies can assess the full productivity of their labor force and determine whether remote or in-office employees are suffering most with efficiency issues.
- Schedule adherence: Which of your employees are sticking to their schedules? Who’s spending the most time “logged in,” and who’s absent? Information like this will show supervisors who can stay the most productive when working remotely. It’s also an excellent way to show your team members who are available for collaboration purposes.
- Calls/Chats answered per hour: Knowing how many calls or chats your staff members get each hour is an excellent way to measure productivity. However, this number becomes more informative when you examine it in combination with other vital business information. Seasonal shifts in call volume or chat numbers must be considered.
- Average speed of answer: This metric, known as ASA, helps organizations to determine how long it takes for agents to answer a call. When the number is too high, it could mean agents are taking too long to pick up new calls or start new chats. If your agent can see they’re lagging behind on your wallboard software, they’ll be more likely to pick up the pace.
- Average hold time with an agent: When an agent answers a call, how often and for how long do they need to put customers on hold? If your agents are putting people on hold while they get help from other remote or in-office employees, maybe you need a better collaboration strategy in place?
- Transfer rate: Customers want a solution the first time they talk to an agent. No-one likes being handed around the workforce. While some transfers are inevitable, your aim should be to keep transfer rates low. Choosing how you route calls to in-office and remote workers could help to reduce transfers, as will showing agents when they’re reaching higher levels on your wallboard screens.
- Average aftercall/chat work time: Most agents will need to complete some basic paperwork or wrap-up tasks after a customer call or conversation. If an agent spends too much time closing out calls and conversations, this could indicate their productivity is suffering. Your wallboard will remind your agents of how quickly they should be wrapping up each interaction.
Remember, productivity metrics are excellent for giving your team members some extra motivation. However, they can also be an insightful way for supervisors and directors to discover where they need to begin repairing any CX deficiencies, and where they should be delivering positive feedback and rewards to top performers.
Our top wallboard tips
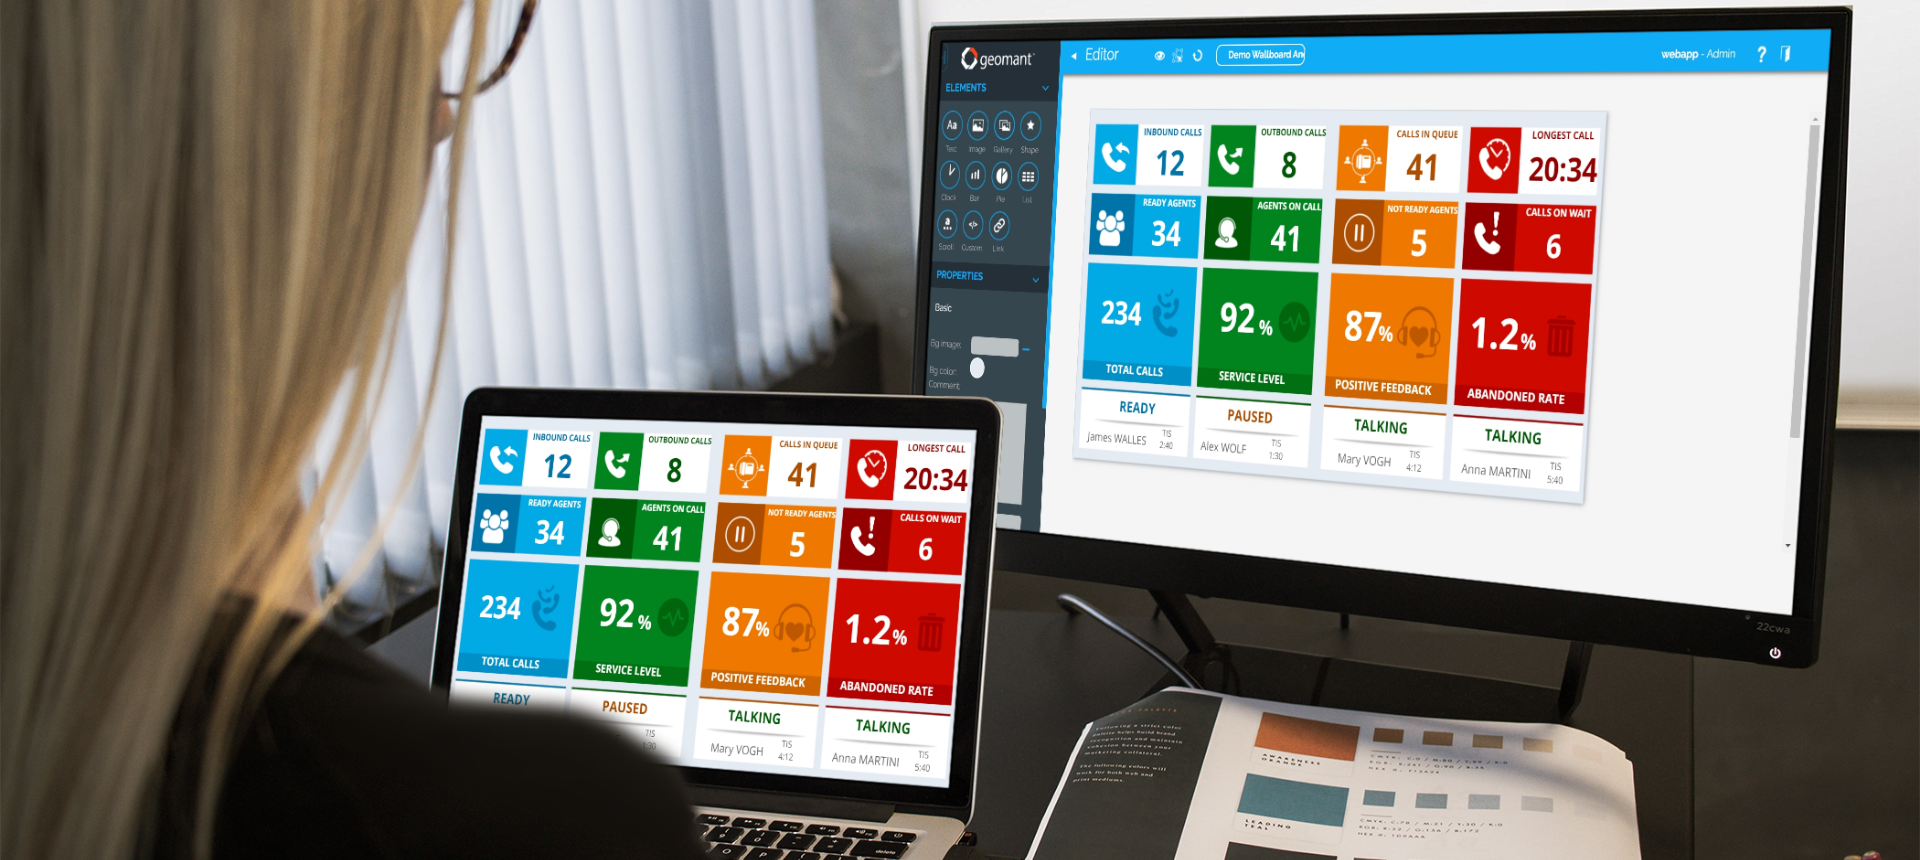
Less is more – As tempting as it might be to fill your wallboard with rich information, don’t crowd the screen. It’s easy for employees to feel overwhelmed by the amount of tech they need to keep track of. Agents working from home may even have smaller screens than they do in the office, making it harder to deal with multiple insights at once. Avoid special effects that might not work on every device and scrolling text that requires team members to sit and watch. Some staff may prefer or require a desktop view, even when working in the office environment.
Use color to signify performance: When glancing at wallboards to check performance levels, agents need quick confirmation of how well they are performing. Colors like red to indicate low performance, yellow to indicate a dip, and green to show your staff that they’re performing well is the most efficient way to display metrics.
Utilize threshold-based alerting and dynamic content – Threshold-based alerting and dynamic content is an excellent way to keep team members motivated. You can use dynamic alerting and messages to congratulate agents whether they’re in the office, or working remotely, when they hit their targets or achieve new benchmarks. This technology is also helpful for broadcast announcements when you need to share information among multiple people at once. Dynamic alerts are particularly valuable for remote agents, which have limited screen space.
